Overview
Cloudprober supercharges your monitoring with active probes (a.k.a. synthetic monitoring) to ensure your systems—homelabs, microservices, APIs, websites, or cloud-to-on-prem connections—run as expected.
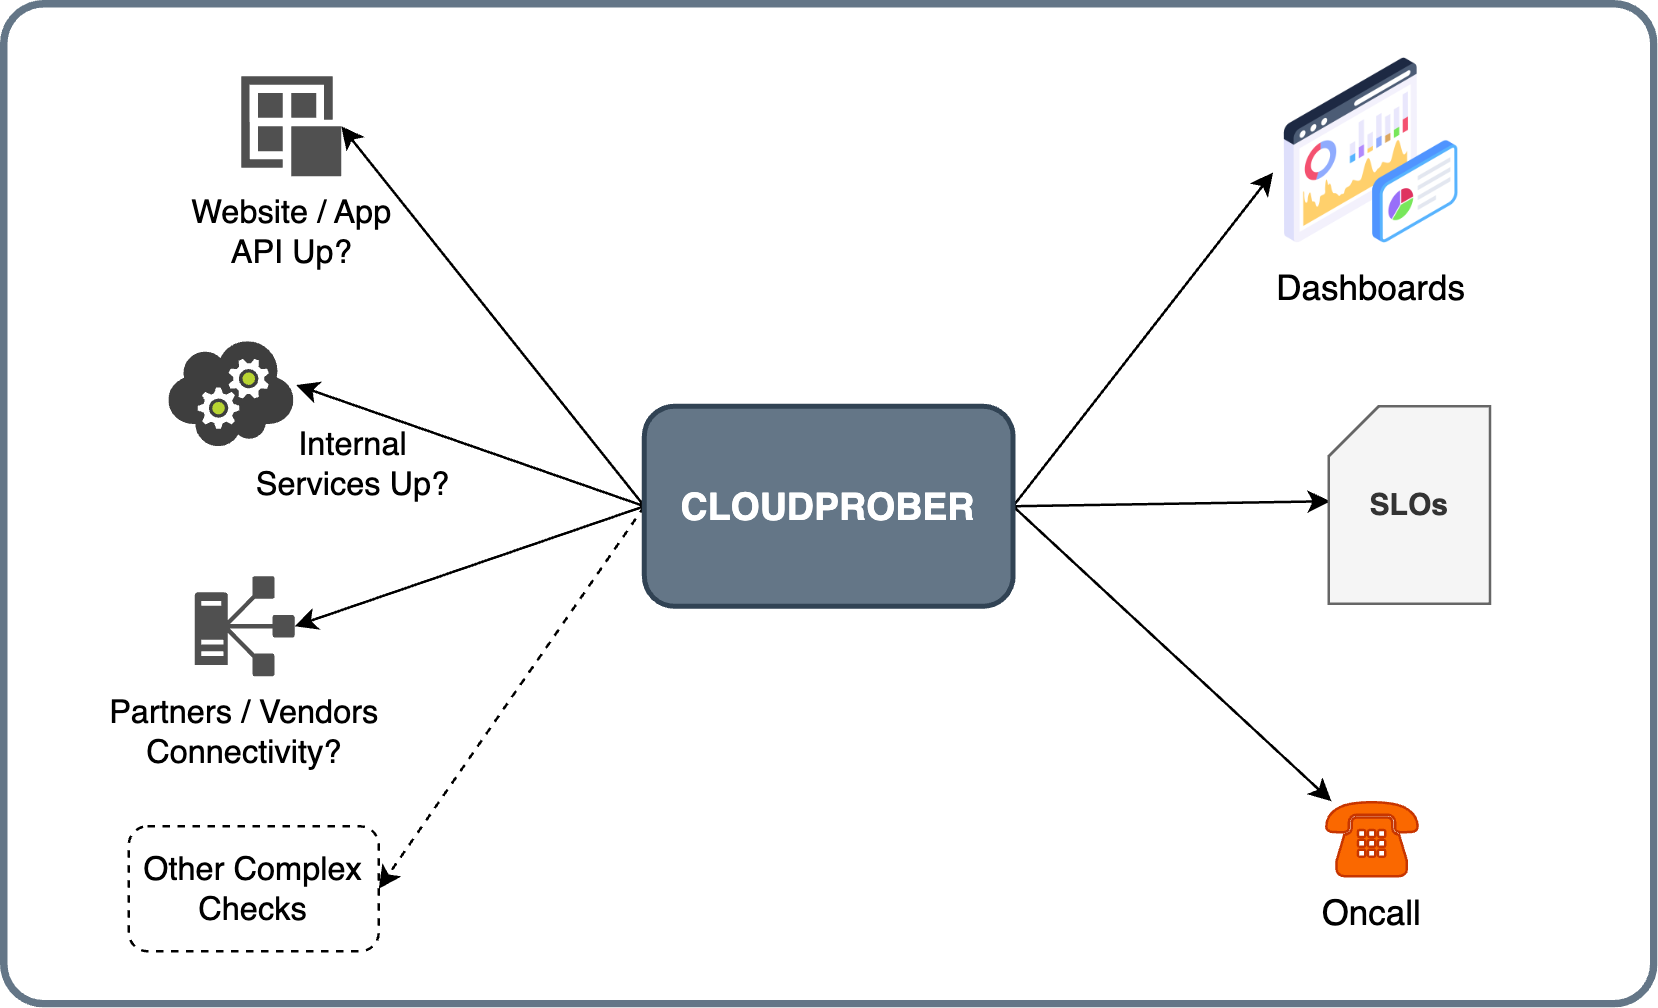
Probes run continuously from wherever you choose to run them, measuring what your users actually experience rather than what your servers report about themselves. See why you need probers for why that turns out to be one of the most reliable monitoring signals you can have.
Ready to try it?
Getting Started has you probing a real endpoint in a couple of minutes: install, one small config file, done.
What’s in the box
| What you get | |
|---|---|
| Probes | HTTP, gRPC, Browser, Starlark script, DNS, PING, TCP, and UDP, plus external commands and Go extensions when you need something else. |
| Targets | Discovered automatically from Kubernetes, GCP, or files, so you’re not redeploying every time your fleet changes. |
| Surfacers | Metrics out to Prometheus, Grafana, Datadog, CloudWatch, PostgreSQL, Google Cloud Monitoring, and more. |
| Alerts | Email, Slack, PagerDuty, Opsgenie, or any HTTP endpoint. |
| Config | Textproto or YAML, with Go templates for when one probe block has to cover hundreds of endpoints. |
Written in Go, it compiles to a single binary and runs as happily on a Raspberry Pi as it does across a global fleet.
Learn more
Coming from Prometheus Blackbox Exporter? See how the two compare: Prometheus Blackbox Exporter vs Cloudprober.
New to the blackbox/synthetic monitoring paradigm? Why you need probers.
Cloudprober’s origin story.
Join the community
Join our Slack, or discuss on GitHub. And if you’re already running it, tell us about it in How do you use Cloudprober?
Follow us on LinkedIn for release notes and updates.