Browser Probe: Getting Started
Cloudprober’s Browser Probe brings continuous end-to-end monitoring to your web applications. It runs real browser interactions – navigating pages, clicking buttons, filling forms – on a schedule, and feeds the results into Cloudprober’s observability pipeline. If your checkout flow breaks at 3 AM, you’ll know in seconds, not when the first customer complaint arrives.
The probe uses Playwright under the hood, so you can leverage existing Playwright tests and the broader ecosystem. But the real value is what Cloudprober adds on top: scheduling, metrics, artifact management, retries, and multi-target support – everything needed to make browser tests operate as production monitoring.
TL;DR: Cloudprober makes Playwright production-ready.
Why Not Just Run Playwright on Its Own?
A standalone Playwright test tells you pass or fail at the moment you run it. That’s fine in CI. In production, you need continuous execution, time-series metrics, alerting, and a way to investigate failures after the fact. Building that yourself means cron jobs, custom metric exporters, artifact storage scripts, and dashboard plumbing. The Browser Probe handles all of it as a first-class Cloudprober citizen.
Automated Observability – Zero Instrumentation
Every Browser Probe run automatically emits:
| Metric | Description |
|---|---|
total / success / latency | Standard Cloudprober probe-level counters |
test_status{test, suite, tags, status} | Per-test pass/fail counter |
test_latency{test, suite, tags, status} | Per-test duration (microseconds) |
These metrics flow directly to any configured surfacer – Prometheus, Stackdriver (Google Cloud Monitoring), OpenTelemetry, CloudWatch, and more – with no extra configuration. You can also configure Cloudprober Alerting to notify you directly via PagerDuty, Slack, Email, or HTTP webhooks when tests fail, giving you end-to-end monitoring without external infrastructure.
Per-Step Custom Metrics
Need to know how long the “Add to cart” step takes inside a checkout test? Enable step-level metrics:
test_metrics_options {
  enable_step_metrics: true
}
This adds two more metric families:
test_step_status{step, test, suite, tags, status}test_step_latency{step, test, suite, tags, status}
In your Playwright test, wrap operations in test.step() and the reporter picks
them up automatically (see the test example below).
Artifacts Management – Built-in Viewer UI
Screenshots, traces, and HTML reports are generated on every run. Cloudprober
stores them, cleans up old ones, and serves them through a built-in Artifacts
Viewer at /artifacts/<probe_name>/.
The viewer lets you:
- Browse by date and timestamp – artifacts are organized as
YYYY-MM-DD/<unix_ms>/<target>/. - Filter by time range – datetime pickers for start/end.
- Filter by failure – a “Failure Only” checkbox highlights runs where the
probe failed (indicated by a
cloudprober_probe_failedmarker file). - Drill down – click through to the Playwright HTML report, individual screenshots, or trace files.
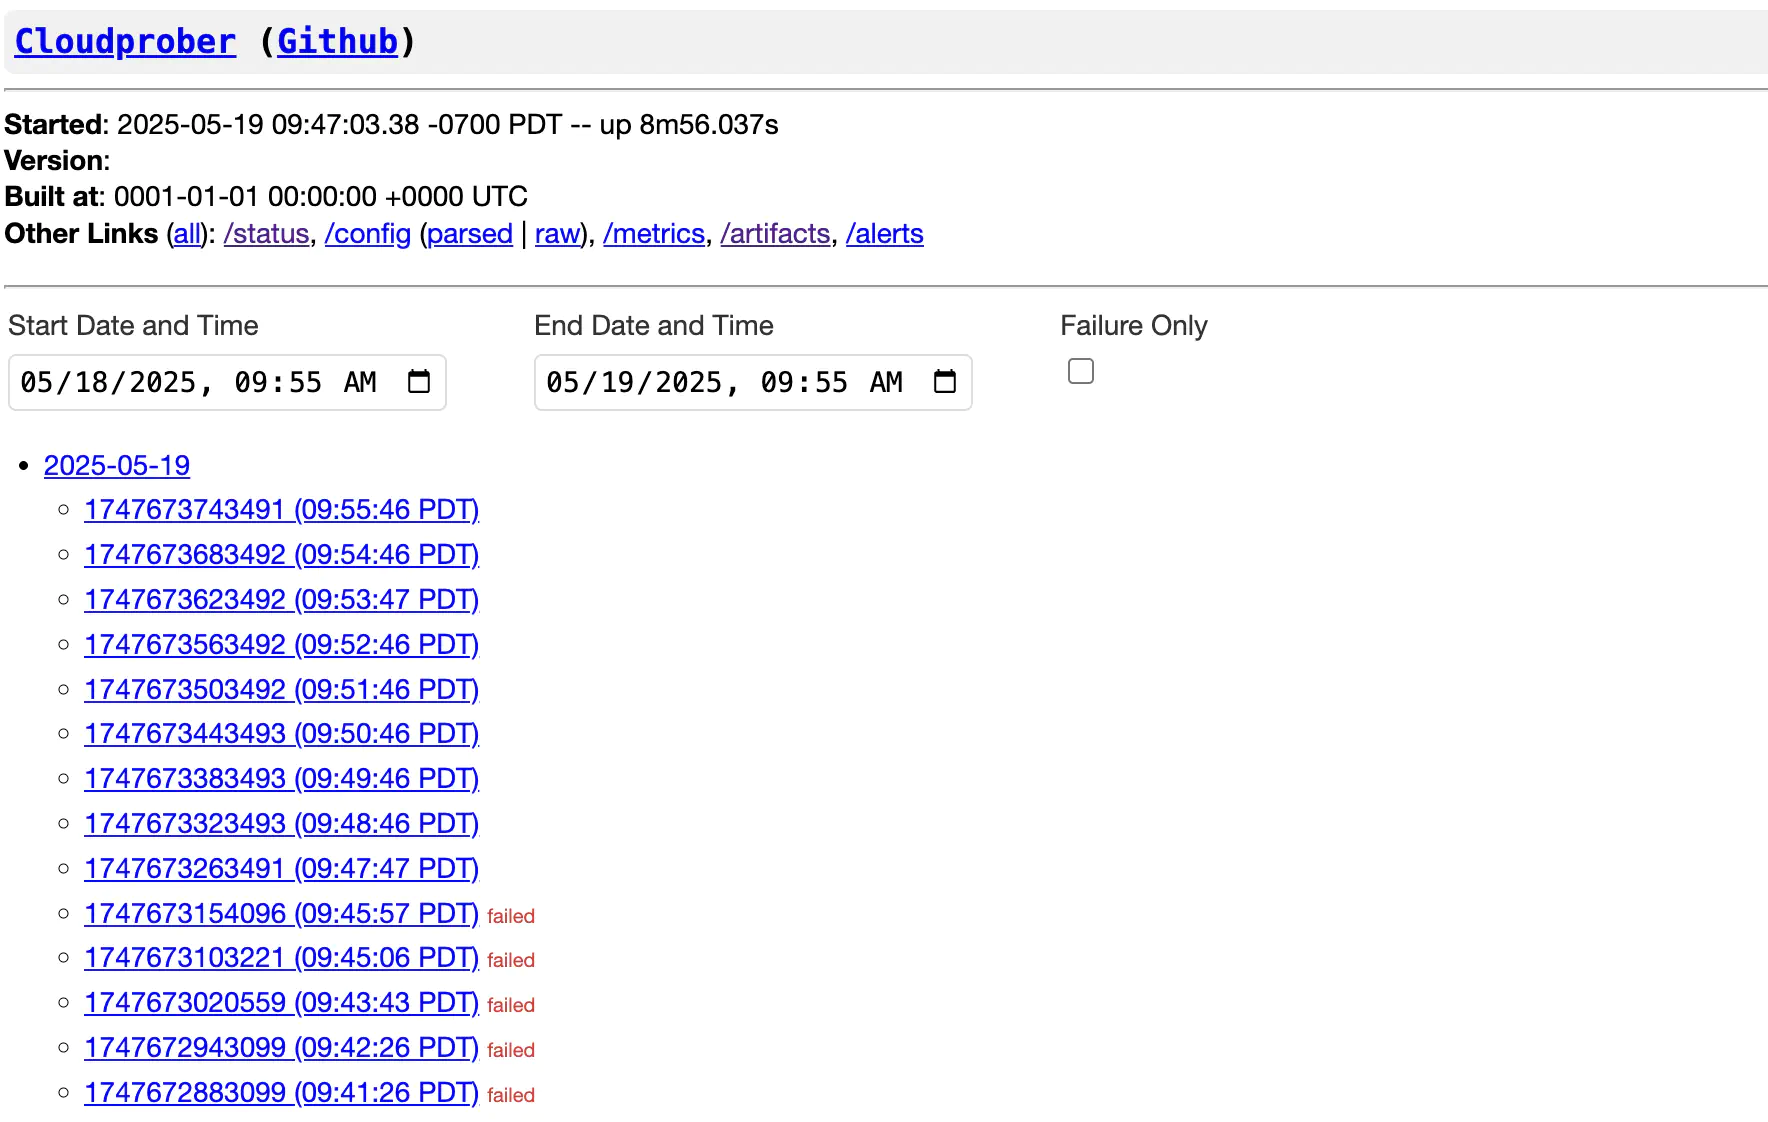
Try it yourself: Live Artifacts Demo
Artifacts can be stored locally and pushed to S3, GCS, or Azure Blob Storage simultaneously – Cloudprober uploads to each backend in parallel without blocking the probe.
Operational Niceties
- Retries with trace capture –
save_trace: ON_FIRST_RETRYcaptures a Playwright trace only when a test is retried, keeping storage lean. - Automatic cleanup – old artifacts are garbage-collected based on
max_age_sec. - Target-aware – environment variables like
target_name,target_ip,target_port, andtarget_label_*are injected into every test run, so a single test spec can probe multiple endpoints.
Quick Start
cloudprober/cloudprober:latest-pw Docker image, which comes with Playwright
and Chromium pre-installed. This avoids the often tricky manual Playwright setup.
See Running with Docker for details.1. Cloudprober Config
probe {
  name: "website_e2e"
  type: BROWSER
  interval_msec: 60000
  timeout_msec: 30000

  targets {
    host_names: "playwright.dev"
  }

  browser_probe {
    test_spec: "website.spec.ts"
    test_dir: "/tests"
    retries: 1
    save_screenshots_for_success: true
    save_trace: ON_FIRST_RETRY
    test_metrics_options {
      enable_step_metrics: true
    }
  }

  global_artifacts_options {
    serve_on_web: true
    storage {
      local_storage {
        dir: "/artifacts"
        cleanup_options {
          max_age_sec: 86400 # keep artifacts for a day
        }
      }
    }
  }
}
This runs website.spec.ts once a minute against playwright.dev, retries
failures once, captures traces on retry, exports per-step metrics, and stores
artifacts locally for 24 hours.
2. Sample Playwright Test (TypeScript)
// /tests/website.spec.ts
import { test, expect } from "@playwright/test";

// target_name is injected by Cloudprober as an env var.
const baseURL = `https://${process.env.target_name}`;

test.describe("Website", () => {
  test("home page and navigation", async ({ page }) => {
    await test.step("Load home page", async () => {
      await page.goto(baseURL);
      await expect(page).toHaveTitle(/Playwright/);
    });

    await test.step("Navigate to docs", async () => {
      await page.getByRole("link", { name: "Get started" }).click();
      await expect(
        page.getByRole("heading", { name: "Installation" })
      ).toBeVisible();
    });
  });
});
Each test.step() call becomes a test_step_status /
test_step_latency metric automatically. No SDK, no custom reporter wiring –
Cloudprober generates the Playwright config and reporter at startup.
Configuration Reference
See generated config reference for all possible options. Here are some key fields:
| Field | Default | Description |
|---|---|---|
test_spec | (all files in test_dir) | Test specs to run. Filenames relative to test_dir; regex patterns passed to Playwright grep. |
test_dir | Config file directory | Directory where test specs are located. |
test_spec_filter | – | Include/exclude tests by title regex. See below for an example. |
save_screenshots_for_success | false | Whether to save screenshots on success |
retries | 0 | Number of retries per test. |
save_trace | NEVER | Trace capture: NEVER, ALWAYS, ON_FIRST_RETRY, ON_ALL_RETRIES, RETAIN_ON_FAILURE. |
test_metrics_options | – | Control test-level and step-level metrics. Ref. |
artifacts_options | (global if set) | Per-probe artifact storage config. Falls back to global_artifacts_options. Discussed in more detail below. |
env_var | – | Extra environment variables passed to Playwright. |
TestSpecFilter
test_spec_filter {
  include: "@smoke|@critical"   # playwright --grep
  exclude: "@draft"             # playwright --grep-invert
}
Artifacts Setup
Enable the Built-in Artifacts Server
The artifacts viewer is served by Cloudprober’s built-in web server but is disabled by default for security. To enable it:
Option A: Global Config (Recommended)
Set global_artifacts_options (ref) at the top level of your Cloudprober config. This
applies to all browser probes and keeps per-probe configs clean.
global_artifacts_options {
  serve_on_web: true
  storage {
    local_storage {
      dir: "/artifacts"
      cleanup_options {
        max_age_sec: 86400          # 24 hours
        cleanup_interval_sec: 3600
      }
    }
  }
}
Option B: Per-Probe Config
Set artifacts_options inside the browser_probe block (as shown in the Quick
Start above). Per-probe options override the global config.
Adding Cloud Storage Backends
Storage backends are defined in the storage field. You can specify multiple
backends – Cloudprober uploads to all of them in parallel.
global_artifacts_options {
  serve_on_web: true

  # Local -- required for the web viewer
  storage {
    local_storage {
      dir: "/artifacts"
      cleanup_options {
        max_age_sec: 86400
      }
    }
  }

  # S3 -- long-term archival
  storage {
    s3 {
      bucket: "my-monitoring-artifacts"
      region: "us-west-2"
    }
    path: "browser-probes"
  }

  # GCS -- alternative cloud backend
  storage {
    gcs {
      bucket: "my-gcs-bucket"
    }
    path: "cloudprober/artifacts"
  }
}
Azure Blob Storage (abs) is also supported with shared-key or managed-identity
auth.
Accessing the Viewer
Once serve_on_web: true is set and Cloudprober is running, open:
http://<cloudprober-host>:9313/artifacts/<probe_name>/
The default Cloudprober port is 9313. The viewer shows a date-grouped index of
all stored runs. Use the datetime pickers and “Failure Only” checkbox to narrow
results during incident triage.
For a raw file tree (useful for scripting / direct links), use:
http://<cloudprober-host>:9313/artifacts/<probe_name>/tree/
Running with Docker
The official Cloudprober images with the -pw tag suffix come with Playwright
and Chromium pre-installed:
docker run --rm -v /path/to/config.cfg:/etc/cloudprober.cfg \
  -v /path/to/tests:/tests \
  -v /tmp/artifacts:/artifacts \
  -v /tmp:/tmp \
  -p 9313:9313 \
  cloudprober/cloudprober:latest-pw
The $PLAYWRIGHT_DIR environment variable is pre-configured in these images, so
you don’t need to set playwright_dir in your config.